
I am currently writing my master’s thesis on the topic of risk matrices. And I thought it would be good to start with the basics before diving into the scientific details.
According to risk expert Mark Powell, making a risk matrix from scratch for a specific risk problem was the norm. But nowadays, this is rarely done anymore. This blog post is based on his lecture during the 2021 Risk Awareness Week, organised by the Risk Academy.
Making a risk matrix can be divided into six steps. I have used Python to make mine. Reach out if you would like to have the code.
Step 1: Choose a Risk Factor Formula
The risk factor (RF) is typically calculated using a formula that combines probability and consequence. A common formula is:
RF = C x P
Where:
- C represents the consequence of the event occurring.
- P represents the probability of occurrence.
Alternatively, a standardised consequence formula can be used:
RF = 1 – (1-C) x (1-P)
This indicates that similar to the probabilities, the consequences fall within a range of 0 to 1.
Step 2: Choose Units and Scale for Consequences
Consequences must be quantifiable to ensure meaningful comparison. A monetary value is commonly used, other units—such as human lives, environmental impact, or operational downtime—may also be appropriate depending on the context.
The consequence scale must be based on the decision-maker’s values and relevance to the problem at hand. The upper end of the scale should represent severe or catastrophic consequences, but determining the exact value is not clear-cut.
The upper limit and scale of the consequences depend on the organisation’s central objective or the objective of the risk problem being studied. Decision makers with a high risk appetite might place catastrophic consequences at the higher end of the scale, while more risk-averse decision makers might place severe consequences at the end of the scale. Often, a logarithmic scale is used for the consequences, but a linear scale is more intuitive to understand.
Step 3: Define Risk Levels
Just as with determining the consequences and the scale for the risk matrix, the risk levels will depend on the characteristics of both the risk problem and the decision-makers. Characteristics of the risk problem may also include external factors, such as risk levels established by the authorities, the industry, regulators, or other stakeholders. Additionally, there may be a difference in risk appetite between the decision-makers.
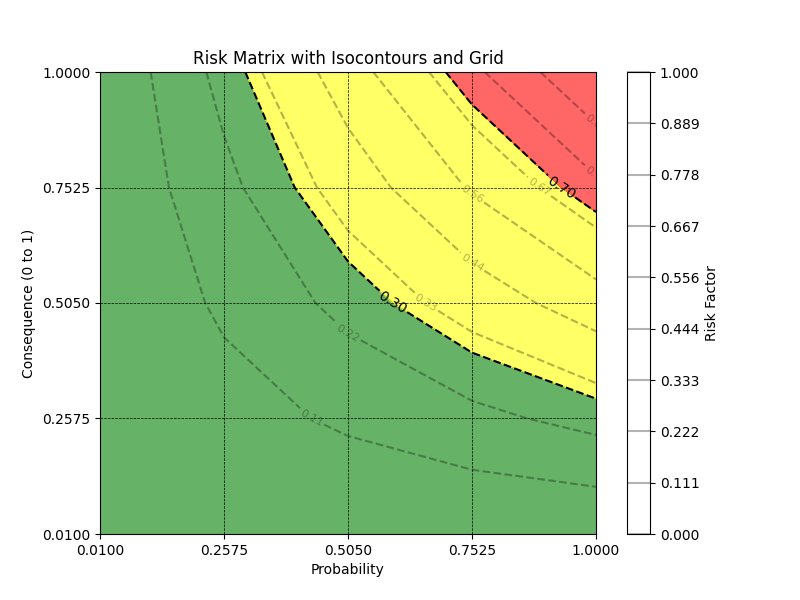
Step 4: Draw the Isocontours
Isocontours are curves or lines representing constant risk levels. These lines visualise how risk increases across the matrix by mapping combinations of probability and consequence that yield the same risk factor.

Step 5: Color Isocontour Regions
Colour-coding enhances the interpretability of the matrix. Typically:
- Green represents low risk (acceptable levels).
- Yellow or orange represents moderate risk (requires monitoring or mitigation).
- Red represents high risk (unacceptable levels requiring immediate attention).
Step 6: Draw the Risk Matrix Grid
Once the isocontours are drawn and color-coded, the final step is to overlay the grid or boxes that segment the risk space into distinct categories. As you can see, the grid doesn’t align perfectly with the isocontoures. The matrix can be left like this, or a decision must be made on what colour to give each grid.

Considerations for Axis Scaling
The axes of the risk matrix require careful consideration:
- Probability Scaling: Decision-makers often perceive probability non-linearly. For example, very low probabilities may be seen as negligible, while high probabilities are treated with disproportionate weight.
- Consequence Scaling: Monetary or other consequence values are often non-linear in impact. For clarity, the consequence axis should be divided into steps that reflect meaningful differences in perceived risk.
- Cognitive Bias Considerations: Since people naturally think in linear terms, visual cues—such as logarithmic spacing or labelled increments—can help users understand non-linear risk scales.
Adjustments for Specific Risk Events
In certain cases, specific risk events deemed unacceptable—even with a very low probability—may necessitate adjustments to the risk matrix. For instance, catastrophic events such as nuclear accidents or major security breaches might require special consideration, overriding traditional risk thresholds.
Conclusion
A risk matrix consists of multiple steps, each with a large impact on the final product. To design a risk matrix well, critical thinking and a good understanding of the risk characteristics, the goal, and the audience are necessary for each step.
Creating a risk matrix involves not only quantitative assessments but also subjective interpretations shaped by the organisation’s context and the decision-makers’ risk appetite. Consequently, a risk matrix can never be entirely objective.
Risk matrices are liked because of their simplicity. However, this simplicity comes at a high cost in terms of model error, potentially leading to worse-than-useless decision support. They should therefore be used and constructed with care.