
“Must have experience with Monte Carlo simulation.”
I see this line often in risk management job postings. It appears in course descriptions, textbooks, and LinkedIn skill endorsements. Yet, few people actually understand what’s happening.
I get it. The mathematics can look complex. But the basic concept is actually not so difficult.
Building my own Monte Carlo Simulation Web application has helped me to understand the concept.

The Problem It Solves
Imagine you’re planning a project with five tasks. You estimate each task will take about 10 days, so you tell your boss: “50 days total.”
But you know it’s not that simple. Some tasks might finish early. Others might run late. How do you account for that uncertainty?
Most people add a buffer, maybe 10% extra. So now it’s 55 days. Done.
This approach is fine when you have a simple task to plan that you understand well. But what if there are 28 variables that all could have an impact on the project’s plan? Then it becomes a lot more complicated.
Monte Carlo simulation solves this by actually running the numbers (hundreds or thousands of times) to show you what’s likely to happen.
What It Actually Does
Instead of giving you one single answer Monte Carlo simulation runs your project thousands of times, each time using slightly different durations within your estimated ranges.
Think of it like this:
- You estimate Task A will take 8-12 days
- The simulation runs Scenario 1: Task A takes 9 days
- Then Scenario 2: Task A takes 11 days
- Then Scenario 3: Task A takes 8 days
- And so on, 1,000 times
After running all these scenarios, you get a distribution showing you: “There’s a 50% chance you’ll finish in 52 days, an 80% chance you’ll finish in 58 days, and a 95% chance you’ll finish in 63 days.”
That’s infinitely more useful than “it’ll take 50 days.”
If your more of a ‘visual learner’ I recommend the video below.
Why It’s Called Monte Carlo
The method was developed in the 1940s by scientists working on the Manhattan Project, which led to the development of the atomic bomb. They named it after the Monte Carlo casino in Monaco because of the role of randomness in the calculations.
The Three-Point Estimate
Most Monte Carlo simulations in project management use what’s called a “three-point estimate.” For each task, you provide:
- Optimistic estimate: Everything goes perfectly (rare, but possible)
- Most likely estimate: Your realistic middle guess
- Pessimistic estimate: When Murphy’s Law strikes (also rare, but possible)
These three points create what’s called a “triangular distribution”, literally a triangle-shaped probability curve, where values near your “most likely” estimate appear more frequently than values at the extremes.
The triangular distribution is often used because it doesn’t require historical data, just three estimates from expert judgment. However, if you have historical data to work with or if you understand how your variable actually behaves, other distributions might be more appropriate.
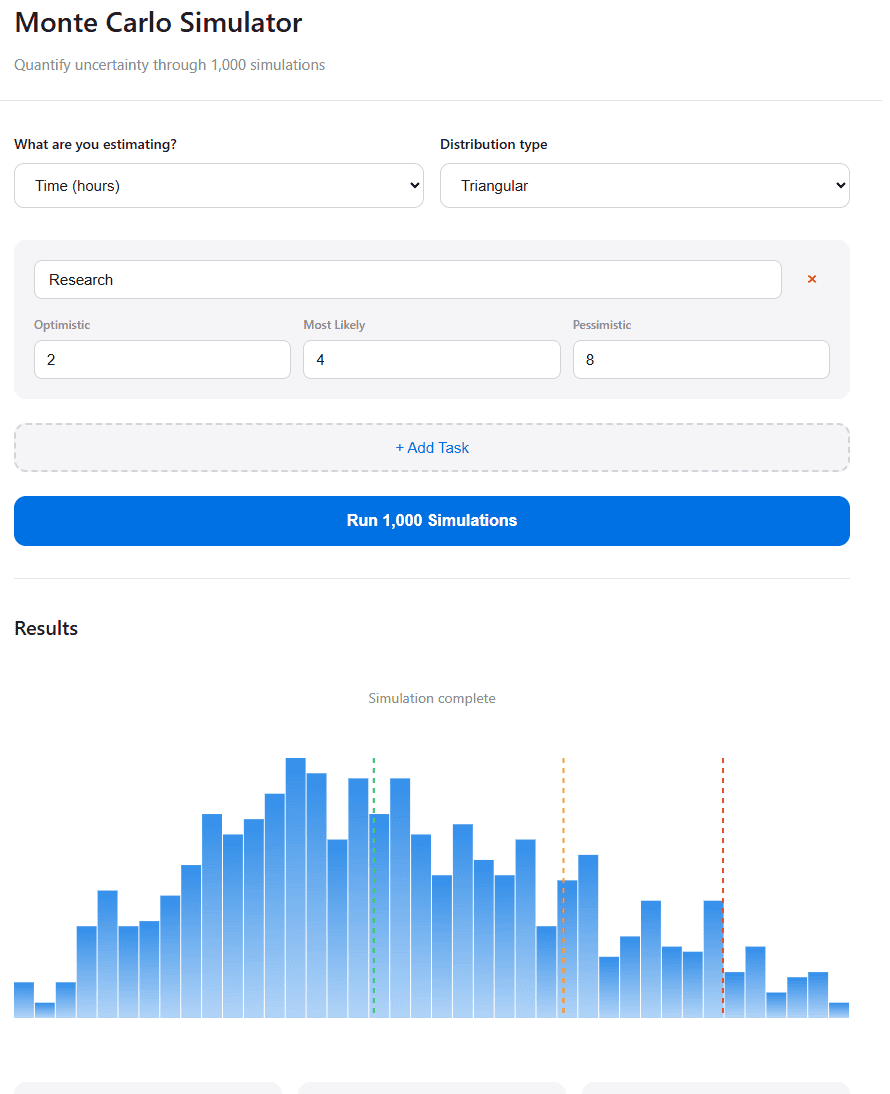
Monte Carlo Simulation Web Application
I’ve built this simulator to show you the process in real-time: Monte Carlo Simulation Web Application.
Step 1: You enter your three estimates for each task (optimistic, most likely, pessimistic)
Step 2: The simulation runs 1,000 scenarios, randomly selecting values within your ranges for each task
Step 3: Watch the histogram build up as scenarios complete, showing you the probability distribution of outcomes
Step 4: Get your confidence levels—P50, P80, and P95—telling you what to expect at different levels of certainty
The magic happens in Step 2. Each time the simulation runs, it randomly picks a value for each task from within your estimated range. Values near your “most likely” estimate get picked more often (that’s what makes it triangular), but the extremes are still possible.
After 1,000 runs, patterns emerge. You see where outcomes cluster. You see the range of possibilities. You see probability taking shape.
Costs vs Revenue: A Note on Perspective
The tool handles both cost/time estimates and revenue estimates, but the logic flips:
For costs or time:
- Optimistic = lower is better (spend less, finish faster)
- Pessimistic = higher is worse (spend more, take longer)
For revenue:
- Optimistic = higher is better (make more money)
- Pessimistic = lower is worse (make less money)
The labels adjust automatically, but the mathematics remain the same. It’s just a matter of perspective.
Model Error
Let’s talk limitations. Because every tool has them, and understanding those limitations is as important as understanding the tool itself.
This simulator won’t:
Account for dependencies. If Task A delays, it might cascade into Tasks B and C. This tool treats each task as independent, which is rarely true in real projects.
Capture unknowns. You’re only modelling the uncertainties you’ve already identified. The risks you haven’t thought of? They’re not in here.
Fix bad estimates. If your three-point estimates are nonsense, you’ll get a beautifully calculated nonsense answer. Garbage in, garbage out.
Make decisions for you. The tool tells you “there’s an 80% chance you’ll finish by Day 58.” Whether 80% confidence is good enough for your project? That’s your call.
The Bottom Line
Monte Carlo simulation isn’t magic. It’s not even that complicated once you see what’s actually happening.
It’s just a way of saying: “Instead of pretending we know exactly what will happen, let’s run the numbers thousands of times and see what’s likely.”
No, it’s not perfect, but when applied right, it’s better than random decision-making.
Leave a Reply