
Tag: Visualisation
-
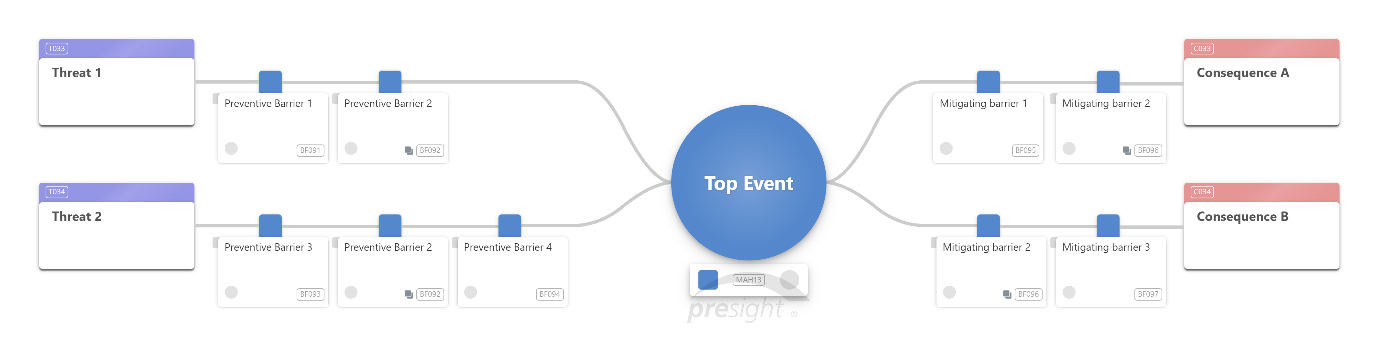
Visual Risk Communication: How Bowtie Diagrams Improve Understanding
Contemporary risks have become more complex, making risk communication more challenging and crucial. This complexity often involves a variety of different stakeholders with their own unique perceptions, understanding and prepositions. Therefore, it is important to employ different risk communication methods to explain these effectively.
-
Which Risk Visualisation to Use?
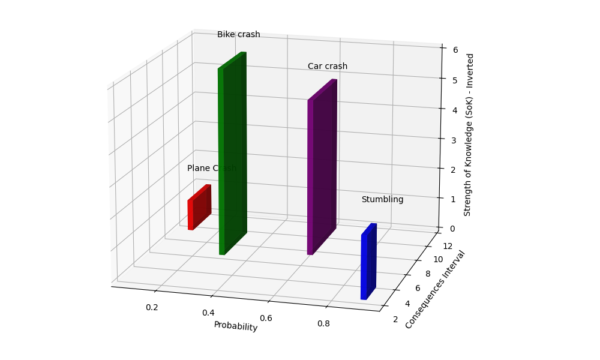
Introduction Risk can be visualised in different ways, each offering unique strengths depending on the decision-making context. Below are 8 risk visualisations and insights on when to use them. 1. Risk Matrix A risk matrix is one of the most common risk visualisation tools, plotting risks in a two-dimensional grid of probability vs. impact. Risks…
-
How to make a Safety Bubble Diagram
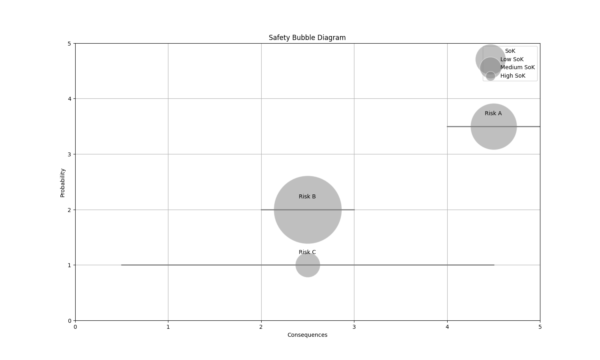
In contemporary risk science, risk is seen from a broader perspective than just the likelihood and consequences of potential events. Aven 2013 introduces a new way of looking at risk that incorporates not just the probability and consequences, but also the uncertainties related to these consequences and probabilities.