
Introduction
I was discussing incident investigation methods with a colleague at work the other day. Dozens of formal methods exist: MTO-Analysis, AcciMap, Tripod and TapRoot, STAMP, and FRAM. And at the simple end of the scale, there is Five Whys, which just keeps asking why until you land on something you can actually act on.
Somewhere in that conversation, one method I hadn’t thought about in years came back to me: the fishbone model, or Visgraatmodel in Dutch, which I first came across during my bachelor’s in Integrale Veiligheid (safety and security management) at NHL University of Applied Sciences. Internationally, it is better known as the Ishikawa diagram, named after its creator, Kaoru Ishikawa.
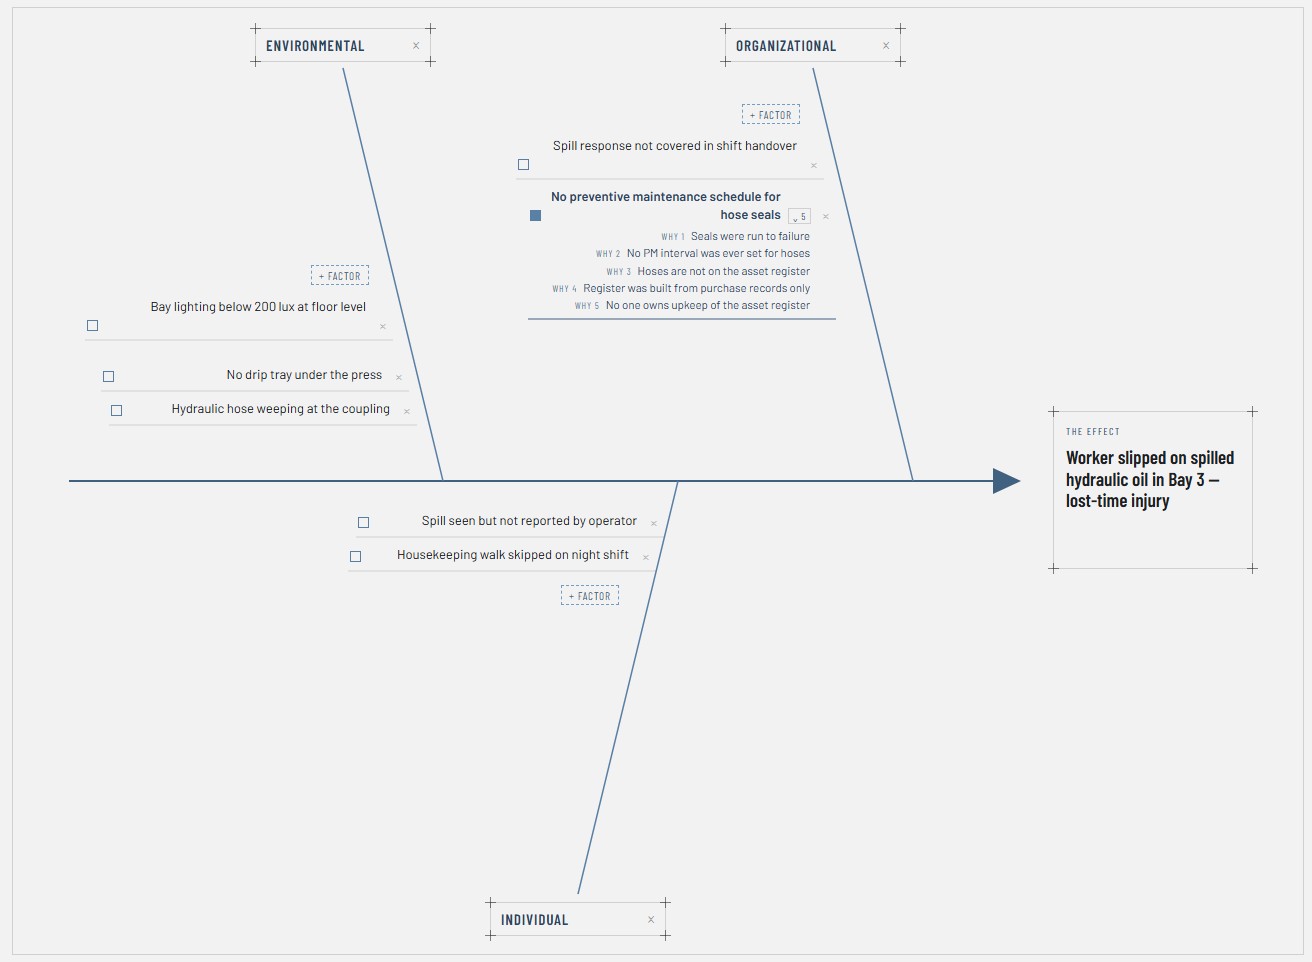
I remembered it because a fishbone is such a recognisable and memorable visual. It’s also an easy method to understand. Unlike most of the methods above, it takes almost no training to use, which is probably why it has spread so far beyond safety investigation and into auditing, healthcare, and everyday problem solving. So I built a free, interactive version of it you can use in the browser. Inputs aren’t saved on refresh, so take a screenshot when you’re ready.
The rest of this post covers what an Ishikawa diagram is, how the classic categories work, and where the technique earns its keep beyond the factory floor: incident investigation, auditing, healthcare, and everyday decision-making.
What Is an Ishikawa Diagram?
An Ishikawa diagram, also called a fishbone diagram or a cause-and-effect diagram, is a visual brainstorming tool for mapping the possible causes of a problem. Japanese quality engineer Kaoru Ishikawa at Kawasaki Heavy Industries developed it.
The problem or effect goes at the head of the diagram. A spine runs back from it, and possible causes branch off that spine like a fish’s bones, which is where the name comes from.
One nuance is worth knowing before you use one. An Ishikawa diagram is meant to structure a brainstorm, not to solve the problem itself. Its job is to lay out every plausible cause in an orderly way so a team can then decide, separately, which ones are worth investigating properly. Treat it as a map of possibilities rather than a verdict, and it does its job well.
The Six Ms: How Causes Get Categorised
Causes are traditionally sorted into six categories, known as the Six Ms. Not every category applies to every problem, and outside manufacturing it is common to swap in categories that fit better, such as people, process, systems, and external factors. Here is what each one is asking.
| Category | What it asks | Example |
|---|---|---|
| People | Was the problem understood? Was there enough training, experience, or communication? | A checklist assumes a level of competence a team member was never actually given |
| Machine | Are the right tools, equipment, or software being used? Could the tool itself be a cause? | A miscalibrated sensor keeps triggering false alarms overnight |
| Method | How is the work actually done day to day, compared with how the procedure says it should be done? | A permit to work process exists on paper but gets skipped under time pressure |
| Materials | What is being used, and is its quality adequate? | A batch of raw material with a wider tolerance than the specification allows |
| Measurement | How is quality or performance actually measured, and how reliable is that measurement? | An inspection interval too long to catch drift before it becomes a failure |
| Environment | What external, physical, or organisational conditions play a role? | Poor lighting, extreme weather, or a culture that quietly discourages raising concerns |
When and where to use
The Ishikawa diagram was born in manufacturing, but the categories generalise well to almost any situation with more than one plausible cause. Incident investigation and auditing are the two areas where I would consider using the diagram.
Incident and Accident Investigation
This is the use case most safety professionals already know. When something goes wrong, the easiest and laziest explanation is human error, but a fishbone diagram forces you to check the other categories too: was the equipment adequate, was the procedure realistic, was the environment a factor, was the measurement or monitoring good enough to catch the problem earlier. By adding the 5 Whys method on top (or maybe rather ‘below’), you drill down further to find underlying causes.
The categorisation is useful, but like any form of modelling, model error occurs. For this method, there is a risk of missing the interrelationships between categories. For example, an initial finding may be that people did not have adequate training to work with certain materials, but those materials could have been replaced with safer alternatives. Don’t disregard, therefore, the possibilities to change or connect categories as you investigate further.
Auditing
Incident investigation and auditing overlap quite a bit. In both cases, we work toward continuous improvement. The starting point is different in most cases. Accidents are not, by definition, the reason to conduct an audit, but accidents and near misses can provide valuable insight for setting up the audit plan.
The strength of the Ishikawa diagram is that it forces the user to look at all the different categories. This prevents tunnel vision of only looking at one aspect, for instance rules and regulations but not taking into account the environment the people operate in. Or only looking at the people involved, but not the materials they work with. Picking the right categories is critical, as it will determine the scope and depth of the audit.
For each category, the auditor can set specific points of interest to collect evidence on. The 5 whys structure works well here, but it should be steered more toward evidence than reasons, since the aim of auditing is to create objective decision support.
For example, if I were to audit a company’s safety management system, the scope would be safety on building sites. I could use the model to put in the questions I want to have answered for each category, and in the ‘ drill-down ‘ or ‘secondary cause ‘, I can write down more specific questions that will help guide me towards the objective audit findings.

Summing up
It was good to revisit some of the methods I first learned about 10 years ago. Having worked with the tools in practice, I now better understand the strengths and weaknesses of these methodologies. I’m curious whether there are any other methods I should cover. Reach out if you have any ideas!