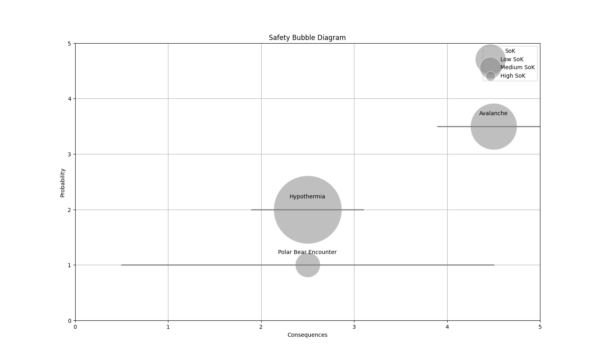
The Arctic environment is characterised by extreme conditions and high levels of uncertainty, creating significant safety risks for operations in the region. Risk awareness is critical for managing these safety risks, as decision-makers must be able to assess and respond to rapidly changing circumstances. In this context, effective risk visualization plays a crucial role in communicating and understanding complex risks. Traditional tools such as risk matrices are not well-suited for the Arctic, as they often fail to capture the uncertainties related to risks in this environment. This paper explores the limitations of risk matrices in the Arctic and introduces the bubble diagram as a more effective alternative. By incorporating probability, consequences, and the Strength of Knowledge (SoK), bubble diagrams offer a more nuanced representation of risk, enabling decision-makers to better understand uncertainties and manage safety risks. Although bubble diagrams are more complex and require careful interpretation, they provide a more reliable tool for Arctic risk management. The paper concludes by recommending the integration of bubble diagrams into Arctic risk management frameworks and highlights areas for future research, particularly in refining the operationalisation of SoK.

Abstract and Presentation: Visualising Safety Risks in Arctic Environments
•
Search
Looking for a specific subject? Try a search below

Leave a Reply