
As you can see from the search data below, cybersecurity is becoming increasingly relevant. Risk management has kept a steady amount of searches over the years. However, by around 2022, a growing gap had emerged between cybersecurity and risk management, with an increasing number of people seeking cybersecurity solutions.
Risk matrices are a standard tool in cybersecurity / or information security risk management. The traditional risk matrix, however, is not suited for most risk problems and is especially ill-suited for cybersecurity risks. The traditional risk matrix has, ever since Antony Cox’s paper “What is wrong with risk matrices” been under heavy academic critique. Cox shows (and proves) that risk matrices can produce worse-than-random decision support. And that they are bad tools for determining the optimal allocation of resources for risk-reducing measures.
Moreover, the traditional risk matrix adheres to the definition of risk as consequences times probabilities. This is not in line with more modern risk definitions that incorporate an element of uncertainty into the risk definition. This brings us to the second point: cybersecurity risks are often subject to significant uncertainties. It is therefore not helpful to use a C*P perspective when analysing cybersecurity risks.
Why Cybersecurity Risks Are Different
Dynamic threat landscape: Unlike operational risks, which often change when we expect them to, cyber threats evolve on a weekly basis. New attack vectors emerge, existing vulnerabilities get patched, and threat actor capabilities shift constantly.
Mixed knowledge environments: We understand some threats well (phishing, malware) whilst others remain poorly characterised (zero-day exploits, supply chain attacks). This creates what I call a “mixed knowledge base” – strong knowledge for established threats, weak data for emerging ones.
Probability: Traditional risk matrices rely on probability estimates. But how do you estimate the probability of a cyber attack? The same vulnerability might be exploited never, once, or repeatedly, depending on factors we can’t predict. This is where most cybersecurity risk matrices fail. They force uncertain, dynamic risks into static probability categories that don’t reflect reality.
Unclear risk criteria: The consequences of cybersecurity events can vary widely from organisation to organisation, or even department to department. It is therefore difficult for an organisation to set meaningful risk criteria. There can, for instance, be significant cascading effects for an organisation. A minor breach in the HR system might expose employee credentials that then provide access to financial systems, creating consequences far beyond the initial impact scope.
Furthermore, the same vulnerability carries entirely different risk implications depending on organisational context. A brief system outage might be merely inconvenient for a manufacturing company, but catastrophic for a financial trading firm. Unlike traditional operational risks, where industry standards provide baseline criteria, cybersecurity risk tolerance varies based on business model, regulatory environment, and technical infrastructure.
What constitutes “acceptable risk” today becomes unacceptable when new attack vectors emerge. Annual risk appetite statements simply cannot keep pace with threats that evolve weekly, making static risk thresholds inadequate for cybersecurity decision-making.
A Better Approach: Effort-Based Assessment
Instead of wrestling with probability estimates, I recommend switching to effort-based assessment. Here’s why this works better for cybersecurity:
Effort reflects exploitability: A vulnerability requiring extensive technical knowledge and specialised tools has a low likelihood of exploitation, regardless of its theoretical probability.
Effort is assessable: Security teams can evaluate the technical effort required more reliably than knowledge-based probability percentages.
The Cybersecurity Risk Matrix
We have established the following points:
- 1. Effort is a more effective indicator than probability when assessing cyber security risks.
- 2. Cyber security risks are dynamic and constantly evolving.
- 3. These risks are often accompanied by significant uncertainties.
- 4. The consequences of cyber security incidents can vary widely.
- 5. There are no clear criteria or thresholds for determining risk levels.
This means that we have to use a risk visualisation that allows us to express these unique characteristics of cybersecurity risks.
| Risk characteristic | Element to express the characteristic |
| 1. Effort is a more effective indicator than probability when assessing cyber security risks. | Effort on the y axes |
| 2. Cyber security risks are dynamic and constantly evolving. | Heatmap to show changes in risk level over time |
| 3. These risks are often accompanied by significant uncertainties. | Bubbles representing the Strenght of Knowledge as an aspect of the risks |
| 4. The consequences of cyber security incidents can vary widely. | Consequences confidence scales instead of fixed places |
| 5. There are no clear criteria or thresholds for determining risk levels. | No grids or isocontours, but continuous scaling |

The scaling should represent the decision-making context. There is therefore not a single best approach. The scaling below, however, can be used as a starting point.
I built a web application to generate a Risk Matrix similar to the one above.
Matrix Dimensions
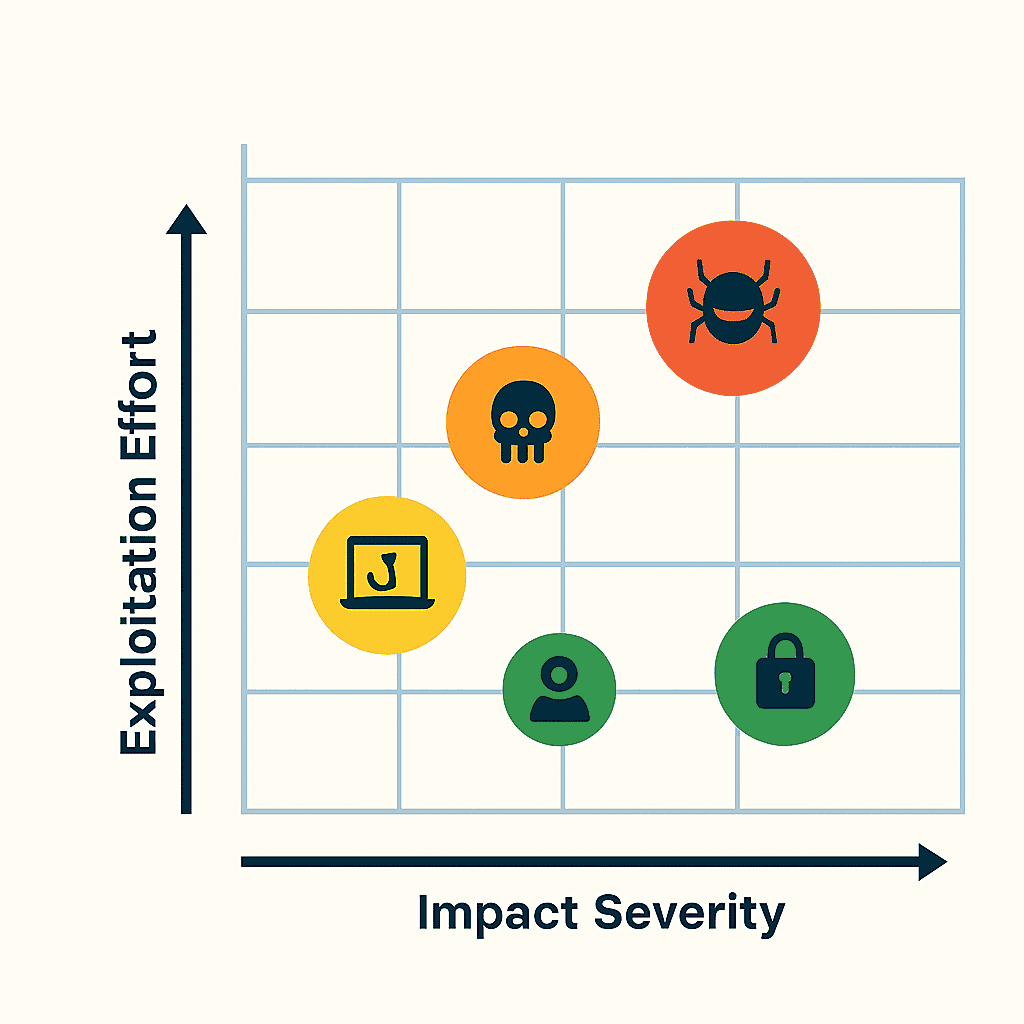
Y-Axis: Exploitation Effort
- Very High: Requires nation-state capabilities
- High: Needs advanced persistent threat resources
- Moderate: Skilled attacker with specialised tools
- Low: Script kiddie with common tools
- Very Low: Automated exploitation possible
X-Axis: Impact Severity
- Negligible: Minor disruption, no data loss
- Minor: Limited data exposure, brief downtime
- Moderate: Significant data breach, operational impact
- Major: Critical system compromise, regulatory implications
- Catastrophic: Complete system failure, existential threat
Adding Uncertainty: The Bubble Approach
For risks with significant uncertainty, use bubble sizes to indicate confidence levels:
- Large bubbles: Weak knowledge (emerging threats, new technologies)
- Medium bubbles: Medium knowledge (established threats with some unknowns)
- Small bubbles: Strong Knowledge (well-understood, documented threats
Implementation
Creating this cybersecurity risk matrix visualisation is more straightforward than it might initially appear. I’ve provided the complete Python code for generating this matrix, which uses matplotlib and numpy libraries. Install the required libraries (pip install matplotlib numpy) and run the script to generate your own cybersecurity risk assessment visualisation.
However, Python isn’t the only route to creating effective risk visualisations. If you prefer Excel or other common business tools, the same principles can be applied with simpler approaches. Rather than overlaying confidence intervals directly onto the matrix, you could present them in separate charts or tables alongside your main risk plot. Let me know in the commons if you’re interested in an Excel cybersecurity risk matrix template.
Python code to use as a template for making a cybersecurity risk matrix or Bubble diagram.
Can’t be bothered to mess with Python? This web app lets you create a cybersecurity risk matrix directly from your browser. Or use the more general and easier-to-use risk matrix builder.
import matplotlib.pyplot as plt
import numpy as np

# Setup
fig, ax = plt.subplots(figsize=(12, 8))

# Risk data: [Impact_min, Impact_max, Effort_min, Effort_max, Bubble_Size, Label, Color]
risks = [
    [1.2, 1.8, 4.7, 5.0, 50, "Phishing emails", "#FF6B6B"],
    [2.4, 3.2, 4.1, 4.6, 50, "Malware via attachments", "#4ECDC4"],
    [2.5, 4.5, 2.5, 4.0, 400, "SQL injection", "#45B7D1"],
    [3.2, 4.8, 1.0, 2.5, 1200, "Supply chain attack", "#96CEB4"],
    [3.0, 4.5, 3.8, 4.7, 400, "Ransomware deployment", "#FFEAA7"],
    [4.0, 5.0, 0.8, 2.0, 1200, "Zero-day exploit", "#DDA0DD"],
    [1.5, 3.5, 3.5, 4.8, 400, "Insider threat", "#FFB347"],
    [2.2, 4.2, 1.2, 2.8, 1200, "APT campaign", "#F0E68C"],
    [1.3, 2.0, 4.8, 5.0, 50, "Automated port scanning", "#98FB98"],
    [3.2, 4.8, 2.8, 4.2, 400, "Business email compromise", "#DEB887"],
    [3.8, 5.0, 1.8, 3.2, 1200, "IoT botnet attack", "#CD853F"]
]

# Set axis limits first
ax.set_xlim(0.5, 5.5)
ax.set_ylim(0.5, 5.5)

# Create heatmap grid that exactly matches the axis limits
x_heat, y_heat = np.meshgrid(np.linspace(0.5, 5.5, 100), np.linspace(0.5, 5.5, 100))

# Create the heatmap with proper extent to align with axes
heatmap_data = x_heat * y_heat
contour = ax.contourf(x_heat, y_heat, heatmap_data, levels=20, alpha=0.4, cmap='Reds', extend='neither')

# Plot confidence intervals and bubbles
for impact_min, impact_max, effort_min, effort_max, size, label, color in risks:
    impact_center = (impact_min + impact_max) / 2
    effort_center = (effort_min + effort_max) / 2

    # Confidence intervals
    ax.plot([impact_min, impact_max], [effort_center, effort_center], color=color, linewidth=3, alpha=0.8)
    ax.plot([impact_center, impact_center], [effort_min, effort_max], color=color, linewidth=3, alpha=0.8)

    # Bubble
    ax.scatter(impact_center, effort_center, s=size, alpha=0.9, color=color, edgecolors='white', linewidth=2, zorder=10)

# Labels and formatting
ax.set_xlabel('Impact Severity →', fontsize=14, fontweight='bold')
ax.set_ylabel('← Exploitation Effort', fontsize=14, fontweight='bold')
ax.set_title('Cybersecurity Risk Matrix: Effort vs Impact with Uncertainty Bubbles and Confidence Intervals', fontsize=16, fontweight='bold', pad=20)

ax.set_xticks(range(6))
ax.set_xticklabels(['', 'Negligible', 'Minor', 'Moderate', 'Major', 'Catastrophic'])
ax.set_yticks(range(6))
ax.set_yticklabels(['', 'Very High', 'High', 'Moderate', 'Low', 'Very Low'])

ax.grid(True, alpha=0.3, linestyle='--')
ax.set_facecolor('#f8f9fa')

# Ensure the plot area is clipped to the axis limits
ax.set_xlim(0.5, 5.5)  # Reapply limits after contourf
ax.set_ylim(0.5, 5.5)

# Legend
legend_elements = [plt.scatter([], [], s=s, alpha=0.7, color='gray', label=l) for s, l in
                   [(50, 'High confidence'), (400, 'Moderate confidence'), (1200, 'Low confidence')]]
ax.legend(handles=legend_elements, loc='upper right', title='Knowledge Confidence',
          bbox_to_anchor=(0.98, 0.98), handletextpad=2.0, borderpad=1.5)

# Risk labels
label_positions = []
for impact_min, impact_max, effort_min, effort_max, size, label, color in risks:
    impact_center, effort_center = (impact_min + impact_max) / 2, (effort_min + effort_max) / 2
    offset_x = -0.3 if "Insider threat" in label else (0.15 if impact_center < 3.5 else -0.15)

    final_x, final_y = impact_center + offset_x, effort_center + 0.1
    for pos in label_positions:
        if abs(final_x - pos[0]) < 0.3 and abs(final_y - pos[1]) < 0.25:
            final_y += 0.2

    label_positions.append((final_x, final_y))
    ax.annotate(label, (final_x, final_y), fontsize=8, ha='center', va='bottom', zorder=20,
                bbox=dict(boxstyle='round,pad=0.3', facecolor='white', alpha=0.9, edgecolor='gray'))

plt.tight_layout()
plt.show()