
Modern risk definitions recognise that risk isn’t just about probability and consequence; it fundamentally involves uncertainty. This uncertainty can be operationalised through probability (P) and the Strength of Knowledge (SoK) assessments. Within the industry, a risk definition including an aspect of uncertainty has generally been incorporated. ISO 31000, for example, defines risk as “the effect of uncertainty on objectives”. However, the actual operationalising of uncertainty, especially the SoK, is still something that is often lacking in day-to-day risk assessments.
In this blog post, I will first outline where the academics are currently at when it comes to the methods and frameworks of operationalising SoK. After that, I will introduce an easy-to-use SoK assessment tool that quickly gives an insight into the SoK of the risk you are assessing.
Current Frameworks and Methods
Recent academic work has advanced both conceptual and practical frameworks for operationalising the Strength of Knowledge (SoK) in risk assessments, addressing the challenge of moving beyond probability alone.
Several recent frameworks provide structured approaches for SoK assessment:
- Hierarchical Quantitative Frameworks: A method that involves a hierarchical framework that breaks SoK into three main attributes: assumptions, data, and phenomenological understanding. Each is further divided into sub-attributes and “leaf” attributes. The assessment is performed in two phases: (1) a top-down reduction to focus on key risk model elements, and (2) a bottom-up scoring of each element using predefined guidelines. Scores are aggregated using weighted averages, with weights determined by the Analytical Hierarchical Process (AHP). This approach yields a quantitative SoK value for the entire risk model, as demonstrated in nuclear power plant risk assessments (Bani-Mustafa et al., 2020; Bani-Mustafa et al., 2018).
- Semi-Quantitative and Qualitative Approaches: Other methods use criteria such as (i) phenomenological understanding and model trustworthiness, (ii) realism of assumptions, (iii) data reliability, and (iv) peer agreement. SoK is then classified into levels (e.g., weak, medium, strong) based on how well these criteria are met (Bani-Mustafa et al., 2020; Aven, 2017; Aven, 2013; Berner & Flage, 2016).
- Fuzzy Multicriteria Decision-Making (MCDM): Unlike the hierarchical method, which assumes you can precisely weight each factor, or the semi-quantitative approach, which gives you broad categories, Fuzzy MCDM lets you express uncertainty (“this factor weighs between 0.25 and 0.35”) whilst mathematically handling how factors influence each other (Bao et al., 2019).
- Knowledge Graphs and AI: Emerging frameworks leverage knowledge graphs and AI (e.g., BERT, GPT-4) to extract, structure, and update knowledge bases for risk assessment, improving transparency and adaptability, especially in complex or data-scarce domains (Shi et al., 2025; Huang et al., 2025; Lee & Lee, 2024; Liu & Yang, 2022).
Is SoK a Value? How Is It Used?
- SoK can be operationalised as a quantitative value (e.g., a score or weighted average), a qualitative level (weak/medium/strong), or a fuzzy score depending on the framework (Bani-Mustafa et al., 2020; Aven, 2017; Bao et al., 2019; Bani-Mustafa et al., 2018).
- The value or level is used to inform risk matrices, prioritise risk management actions, and communicate the confidence or uncertainty underlying risk estimates (Aven, 2017; Aven, 2013; Berner & Flage, 2016).
- Some frameworks recommend explicitly displaying SoK alongside probability and consequence in risk matrices or as an additional risk dimension (Aven, 2017; Aven, 2013).
Academic Consensus and Practical Guidance
- There is broad agreement that SoK should be systematically assessed and communicated, not just assumed.
- The most advanced frameworks combine structured attribute-based scoring, expert judgment, and, increasingly, AI-driven knowledge management.
- Practical implementation requires clear guidelines, scoring rubrics, and, where possible, integration with digital knowledge management systems (Bani-Mustafa et al., 2020; Bao et al., 2019; Bani-Mustafa et al., 2018; Lee & Lee, 2024).
Table 1: Comparison of leading SoK assessment frameworks and their operationalisation.
| Framework/Method | SoK Representation | Key Features/Criteria | Citations |
|---|---|---|---|
| Hierarchical Quantitative (AHP-based) | Quantitative (score) | Assumptions, data, phenomenology; weighted aggregation | (Bani-Mustafa et al., 2020; Bani-Mustafa et al., 2018) |
| Semi-Quantitative/Qualitative | Levels (weak/medium/strong) | Model trust, data, assumptions, peer agreement, scrutiny | (Bani-Mustafa et al., 2020; Aven, 2017; Aven, 2013; Berner & Flage, 2016) |
| Fuzzy MCDM | Fuzzy score | Automated extraction, updating, and transparency | (Bao et al., 2019) |
| Knowledge Graph/AI-based | Structured knowledge base | Automated extraction, updating, transparency | (Shi et al., 2025; Huang et al., 2025; Lee & Lee, 2024; Liu & Yang, 2022) |
Try It Yourself: The SoK Assessment Tool
I’ve built a simple tool to help you assess the Strength of Knowledge for your own risk assessments. It’s practical, structured, and doesn’t require a PhD to use.

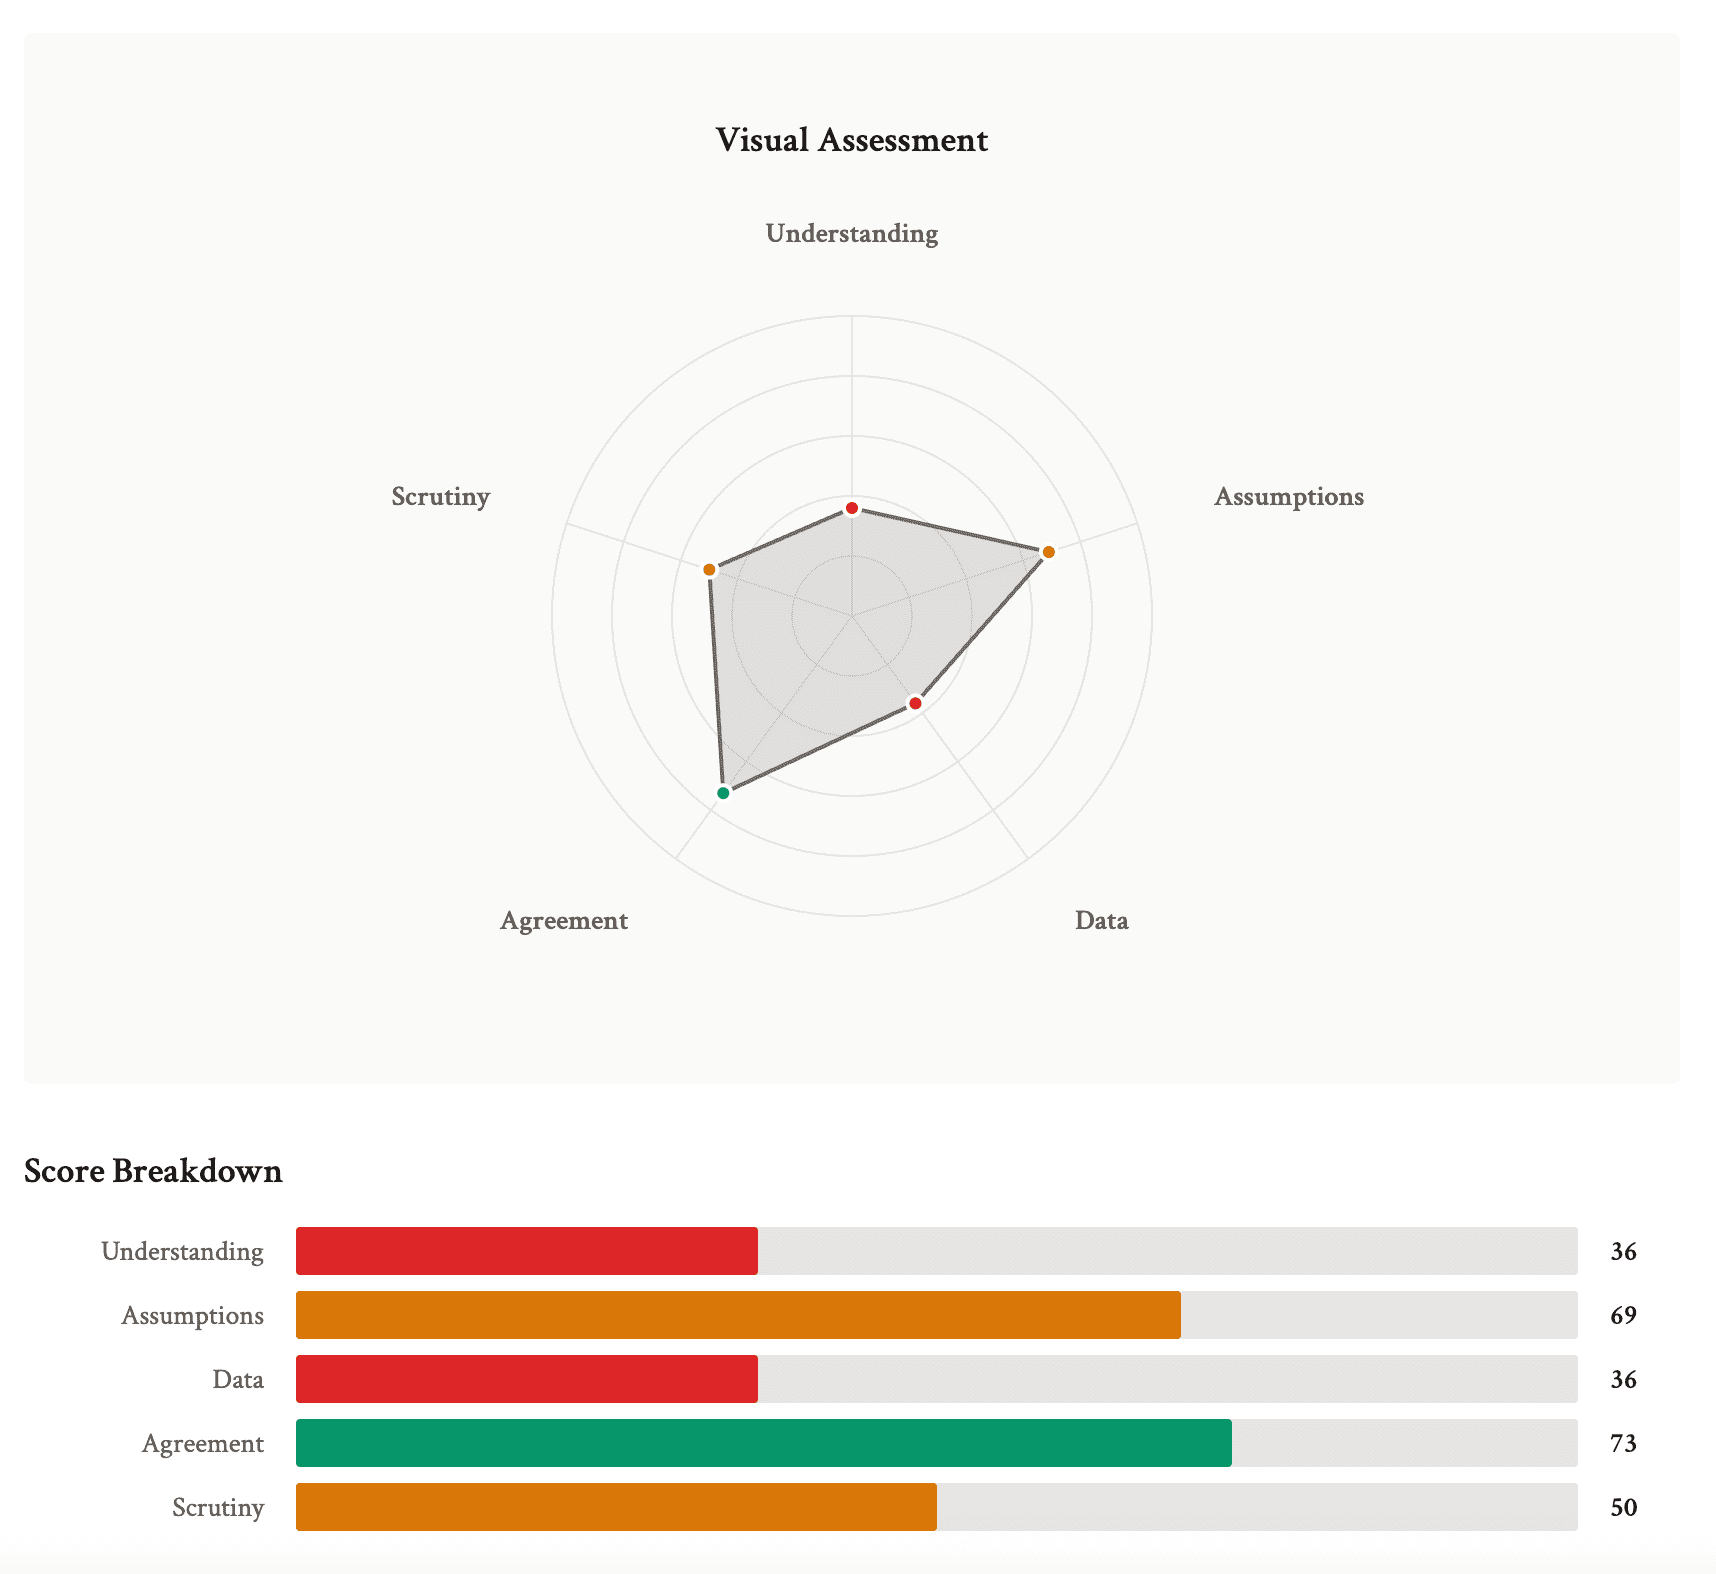
The tool walks you through evaluating:
- Your phenomenological understanding
- The realism of your assumptions
- Your data reliability
- The level of peer agreement
- How thoroughly has the knowledge been scrutinised
You’ll get a SoK rating (weak, medium, or strong) that you can use to contextualise your risk assessment results.
Some words of caution
Like any model, this tool has limitations. The current implementation uses a simple averaging approach with some threshold rules, which can work well but also has potential blind spots.
If you score, for example, very low on one criterion (say, 10 out of 100 on “Assumptions”) but high on all others (80+ each), the tool might still give you a “Medium” overall rating. In reality, if your assessment rests on fundamentally unrealistic assumptions, the whole analysis could be worthless, regardless of how good your data or models are.
How to Actually Use SoK in Practice
Here’s what I recommend based on both research and practical experience:
1. Assess SoK alongside probability and consequence
Don’t wait until the end of your risk assessment to think about knowledge strength. Assess it as you go. This helps you identify where you need more information before making critical decisions.
2. Display SoK in your risk matrices

This is crucial for risk communication. When presenting risks to decision-makers, explicitly show the strength of knowledge backing each assessment. A ‘high’ risk based on weak knowledge deserves different treatment than a ‘high’ risk based on strong knowledge (Aven, 2017; Aven, 2013).
3. Use SoK to prioritise research and data collection
High-impact risks with weak SoK should trigger alarm bells. These are your priorities for additional research, better data collection, or expert consultation.
4. Be honest about limitations
There’s pressure to appear certain, to give stakeholders clear answers. But hiding weak knowledge doesn’t make it go away; it just means bad decisions get made with false confidence.
Summary
The latest academic thinking emphasises structured, transparent, and often quantitative frameworks for SoK assessment, with practical tools ranging from scoring rubrics to AI-driven knowledge graphs. SoK can be a value, a level, or a fuzzy score, and its explicit assessment is increasingly seen as essential for robust, credible risk analysis.
References
Bani-Mustafa, T., Zeng, Z., Zio, E., & Vasseur, D. (2020). A practical approach for evaluating the strength of knowledge supporting risk assessment models. Safety Science. https://doi.org/10.1016/j.ssci.2019.104596
Aven, T. (2017). Improving risk characterisations in practical situations by highlighting knowledge aspects, with applications to risk matrices. Reliab. Eng. Syst. Saf., 167, 42-48. https://doi.org/10.1016/j.ress.2017.05.006
Bao, C., Wu, D., & Li, J. (2019). A Knowledge-Based Risk Measure From the Fuzzy Multicriteria Decision-Making Perspective. IEEE Transactions on Fuzzy Systems, 27, 1126-1138. https://doi.org/10.1109/tfuzz.2018.2838064
Bani-Mustafa, T., Zeng, Z., Zio, E., & Vasseur, D. (2018). Strength of knowledge assessment for risk informed decision making. Safety and Reliability – Safe Societies in a Changing World. https://doi.org/10.1201/9781351174664-12
Shi, R., Chen, T., Lu, C., Shang, D., Luo, J., Hui, X., Li, H., & He, H. (2025). Dynamic Assessment and Early Warning of Cross-Border Pipeline Risks Based on Knowledge Graph. 2025 8th International Conference on Advanced Electronic Materials, Computers and Software Engineering (AEMCSE), 374-377. https://doi.org/10.1109/aemcse65292.2025.11042435
Aven, T. (2013). Practical implications of the new risk perspectives. Reliab. Eng. Syst. Saf., 115, 136-145. https://doi.org/10.1016/j.ress.2013.02.020
Huang, X., Li, P., Wang, Y., Ren, X., Zhao, Z., & Li, G. (2025). Knowledge Graph-Augmented ERNIE-CNN Method for Risk Assessment in Secondary Power System Operations. Energies. https://doi.org/10.3390/en18082104
Lee, W., & Lee, S. (2024). Development of a Knowledge Base for Construction Risk Assessments Using BERT and Graph Models. Buildings. https://doi.org/10.3390/buildings14113359
Berner, C., & Flage, R. (2016). Strengthening quantitative risk assessments by systematic treatment of uncertain assumptions. Reliab. Eng. Syst. Saf., 151, 46-59. https://doi.org/10.1016/j.ress.2015.10.009
Liu, C., & Yang, S. (2022). Using text mining to establish knowledge graph from accident/incident reports in risk assessment. Expert Syst. Appl., 207, 117991. https://doi.org/10.1016/j.eswa.2022.117991
Leave a Reply