
Tag: Graph
-
Which Risk Visualisation to Use?
•
Introduction Risk can be visualised in different ways, each offering unique strengths depending on the decision-making context. Below…
-
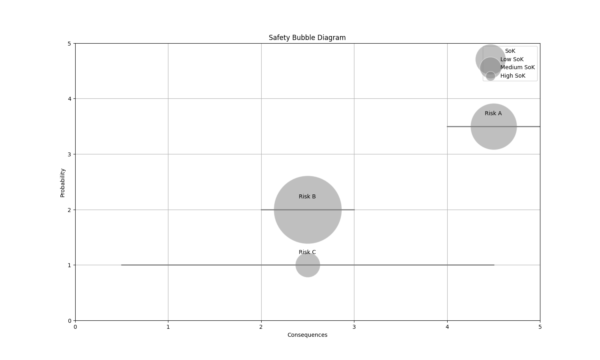
How to make a Safety Bubble Diagram
•
In contemporary risk science, risk is seen from a broader perspective than just the likelihood and consequences of…
-
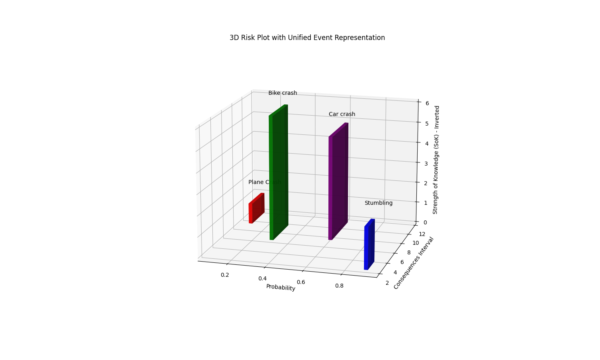
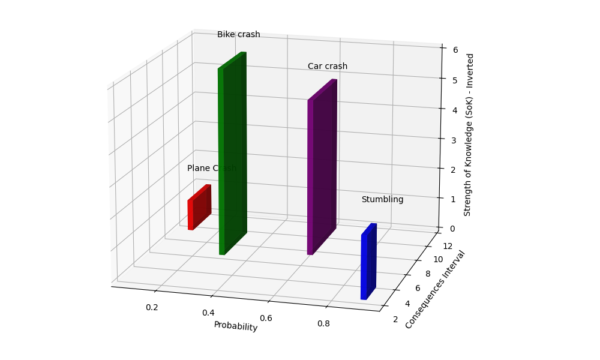
How to make a Risk Plot
•
Introduction In contemporary risk science, risk is seen from a broader perspective than just the likelihood and consequences…
Search
Looking for a specific subject? Try a search below