
Scrolling through LinkedIn, I came across a post from the Society for Risk Analysis pointing to a new publication, Redesigning Risk Assessments in the Age of AI: Emergence of the Opacity Risk Dimension by Helmi Issa. It has a strong focus on visualising risk, which has become my main topic, so it caught my eye.
The paper starts by arguing that a two-dimensional definition of risk, probability times consequence, is insufficient, and that the traditional two-dimensional risk matrix is therefore inadequate or even misleading for most use cases. There has been consensus on this point for the best part of two decades, ever since Tony Cox’s seminal 2008 paper, “What’s Wrong with Risk Matrices?”. Yet it is worth repeating because the traditional two-dimensional risk matrix is still widely used in practice.
The fix is to add an element of uncertainty to the definition of risk, and the industry is slowly catching up. Arguably, the most relevant standard here is ISO 31000, which redefined risk as the “effect of uncertainty on objectives”. That definition was introduced in the 2009 edition and retained in the current 2018 revision.
In practice, though, there are still few practical tools for dealing with this element of uncertainty. So we have to reach back to the scholars. Aven (2012) argues that in risk analysis, we should also account for the Strength of Knowledge supporting our measures of probability and the severity of the consequences.
Issa, however, argues that with opaque AI systems, these judgements about the strength of knowledge cannot be made, and that we therefore need a different measure: opacity. As the author defines it, opacity is a measure of how far we are from explaining why a system failed, i.e., the degree to which the cause, mechanism, or reasoning behind a potential failure remains unexplainable. Drawing on Buttaboni and Floridi (2025), the paper treats opacity as a bundle of four ideas: transparency, traceability, interpretability, and explainability. And it argues that none of these questions is captured by the uncertainty-risk framework.
I think that is a bit of a stretch. Looking back at the Strength of Knowledge assessment tool I built, which I based on the literature operationalising uncertainty, “Phenomenological Understanding and Model Trustworthiness” is one of the criteria. That criterion comes from Flage and Aven (2009), whose list of what makes knowledge strong includes the degree to which the phenomena involved are understood and accurate models exist (a formulation restated in Aven and Thekdi, 2022). That, at the very least, captures a part of opacity.
A conceptual debate is not really my focus area, though. I will leave that to the scholars. What I am most interested in is how these academic insights can be used in practice, and there I agree with Issa: opacity is highly relevant when defining risk levels for AI, and we should integrate it into our risk analysis. The most practical way to do that, I would argue, is to make opacity more explicit within the Strength of Knowledge assessment. At the same time, I do not think it is helpful to replace the Strength of Knowledge dimension with opacity. Adding opacity does not make Strength of Knowledge irrelevant.
Bringing opacity into the Strength of Knowledge criteria
So, rather than bolting on a new axis, here is how I would sharpen the five criteria in my current tool so that opacity becomes prevalent whenever the risk in question involves AI. The left-hand column is the criterion as it stands. The right-hand column is the opacity lens: the extra question to ask when the system under assessment is a machine learning model.
| Strength of Knowledge criterion | What it asks in a normal assessment | The opacity lens for AI systems |
|---|---|---|
| Phenomenological Understanding & Model Trustworthiness | Do we understand the underlying mechanism, and are the models reliable and proven? | Can experts explain how the model turns inputs into outputs, or is it a black box? |
| Realism of Assumptions | Are the assumptions behind the assessment reasonable and evidence-based? | For an AI system, a central assumption is that the training data represents the world it will actually operate in. Is that assumption traceable and defensible, or simply unknown? |
| Data Reliability & Availability | Do we have enough good-quality data behind the estimate? | Transparency. Are the training data, their provenance, and their known biases disclosed and auditable, or hidden? |
| Expert & Peer Agreement | Do independent experts agree, and has the assessment been validated? | Has the model been independently audited, red-teamed, or externally explained, or does the vendor simply assert that it works? A lack of third-party scrutiny is itself a marker of opacity. |
| Knowledge Scrutinisation | Has the knowledge been challenged and tested for surprises? | Traceability and explainability after the fact. When the system produces a bad output, can we trace and explain that individual decision, and has the system been probed for emergent, unexpected behaviour? |
Read this way, opacity is not a dimension competing with the others. It is a lens that sharpens them and concentrates on the first criterion: understanding and model trustworthiness. A genuine black box, where nobody can explain why the model does what it does, simply scores very low on that criterion, which drags the overall Strength of Knowledge rating down. It tells us that the tidy risk number on the page rests on thin knowledge and should be treated with caution.
Visualising the Risk
Opacity is a real and important feature of AI risk, but its natural home is inside the Strength of Knowledge assessment, sharpening the criteria we already use rather than replacing them. Once opacity lives there, we can also show it, which is where visualisation comes in.
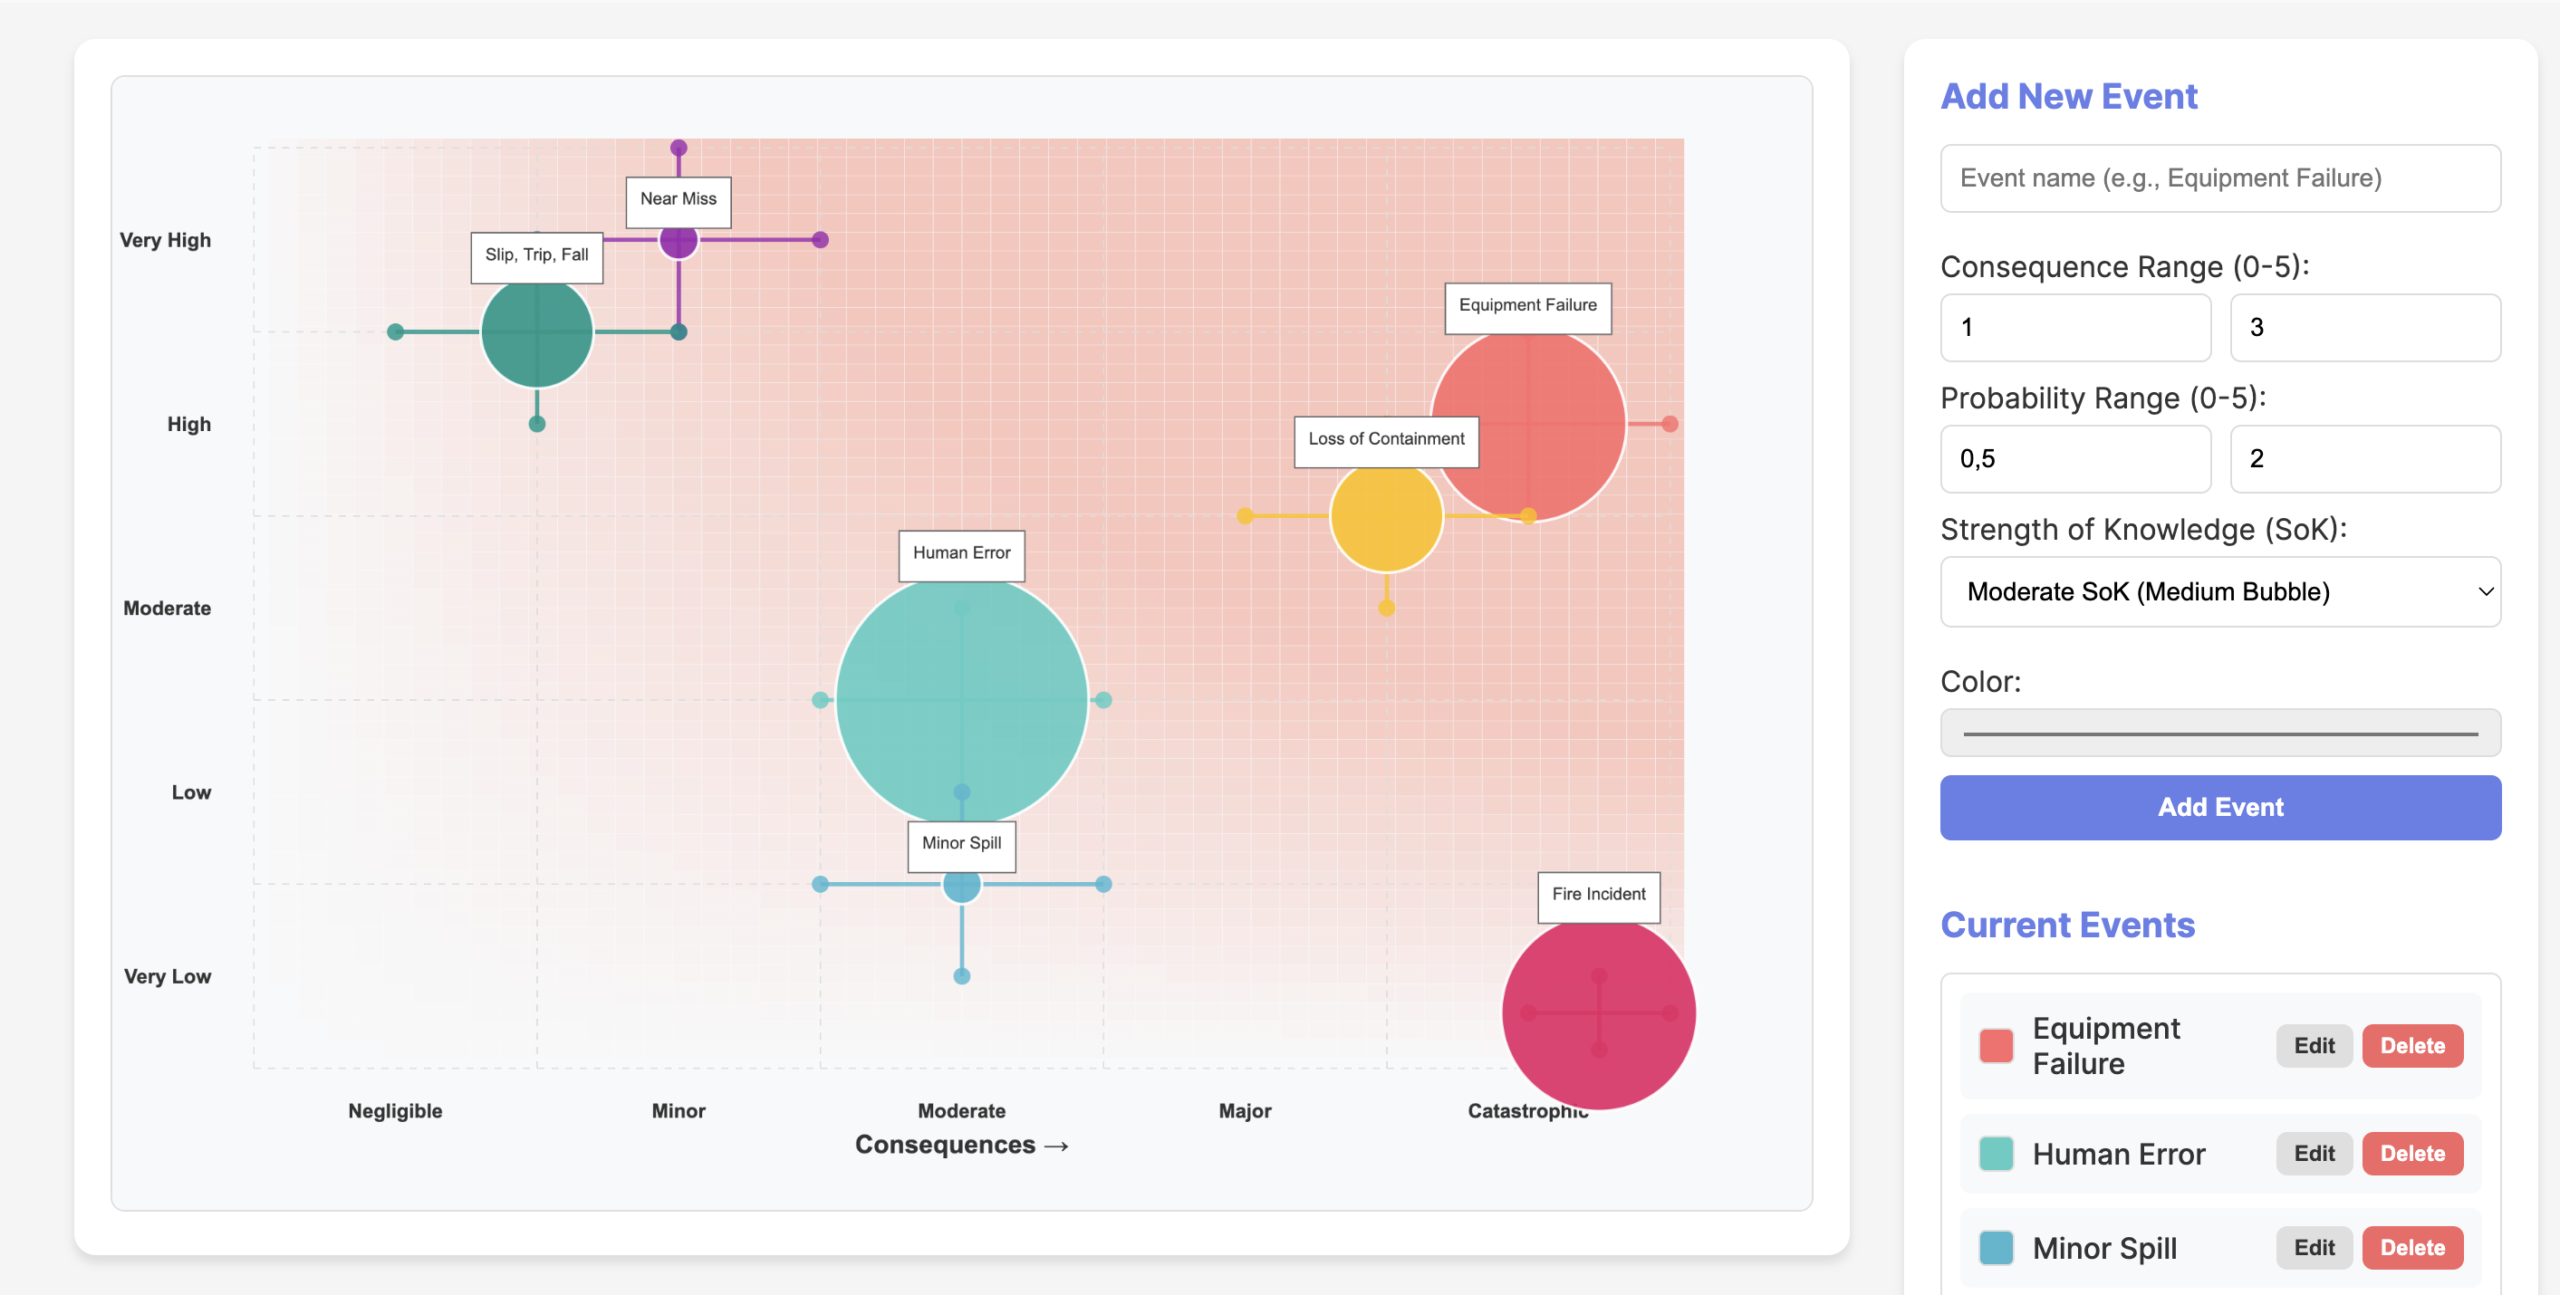
My suggestion is to pair two tools I have already built. First, run each AI risk through the Strength of Knowledge assessment tool, taking into account the opacity lens above, to land on a weak, medium, or strong rating. Then carry that rating into the bubble diagram, where probability and consequence set each risk’s position on the grid, and the Strength of Knowledge rating sets the size of the bubble.

The result is a holistic risk visualisation in a single, familiar picture. Probability and consequence tell you where a risk sits; Strength of Knowledge, now carrying the opacity signal, tells you how much to trust that position. A genuinely opaque, black-box AI risk shows up as a large, low-confidence bubble that demands attention regardless of where it lands on the grid.
Have you had to assess the risk of a black-box AI system, or worked with Strength of Knowledge in practice? I would be curious to hear whether you would treat opacity as its own dimension or, as I do, as a sharper way of asking how much we really know. Drop a comment below or reach out on LinkedIn.